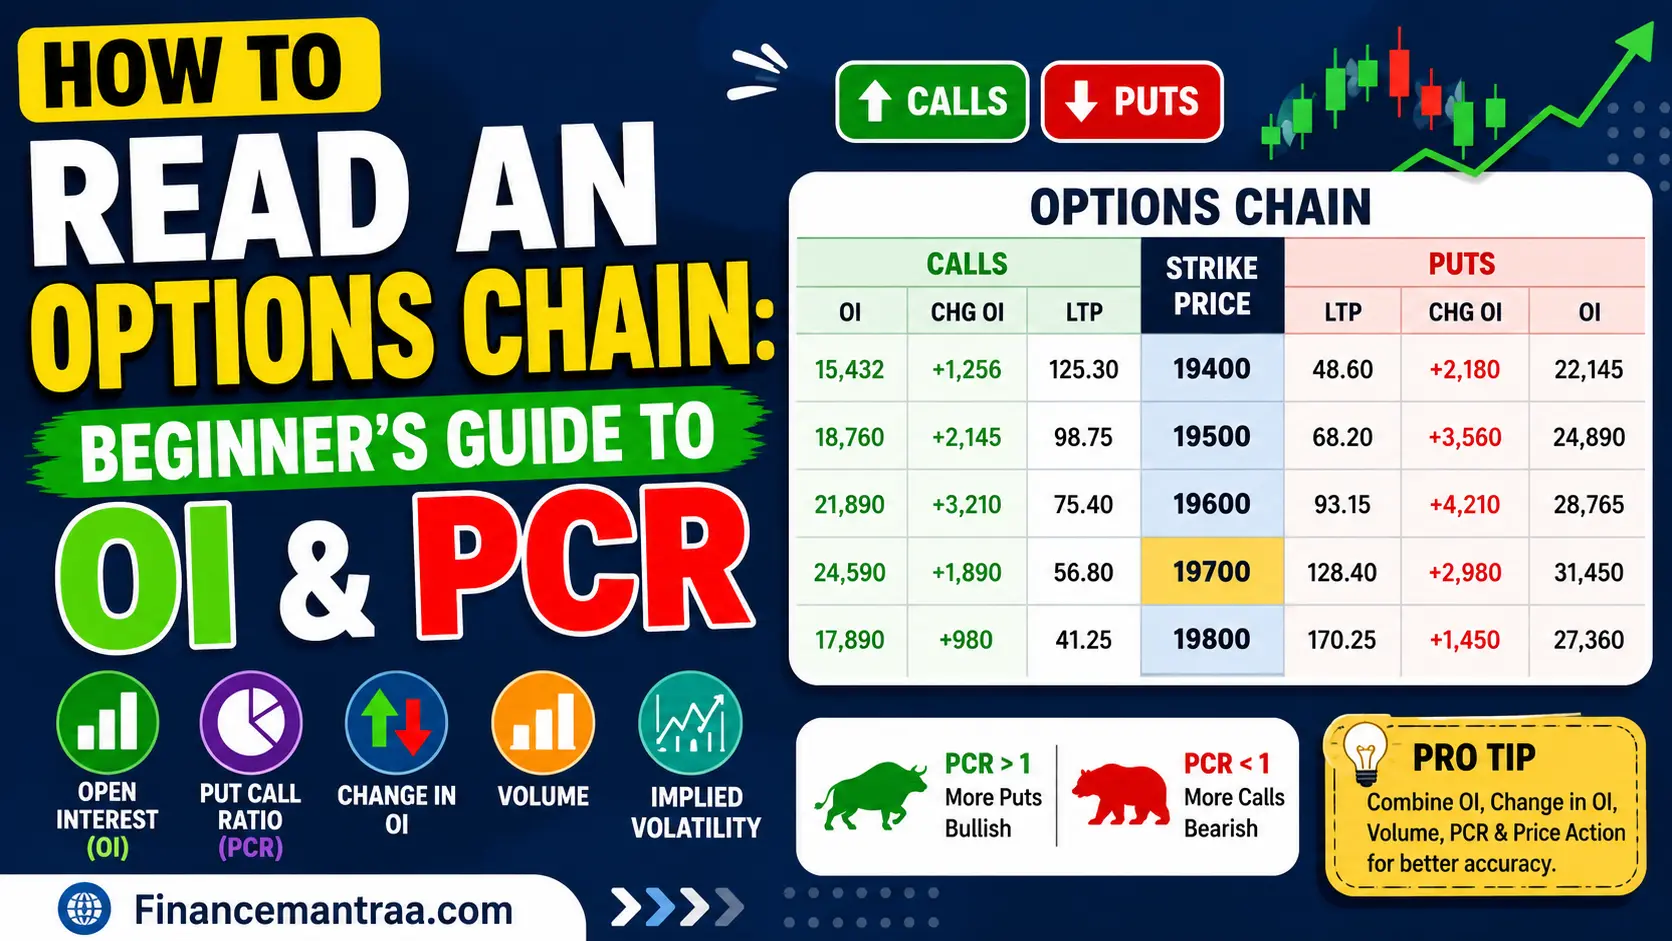
Friends, have you ever opened an options chain on your trading app and felt totally lost? So many numbers, so many columns, and you have no idea what any of it means. I know that feeling very well. When I first started, I closed the app within two minutes because it looked like rocket science. But believe me, it’s much easier than it hard. Once someone explains it in simple words, it becomes easy to understand. In this article, I will show you how to read an options chain step by step, so even if you are a complete beginner, you will understand it clearly by the end.
Learning how to read an options chain is one of the most useful skills for anyone who wants to trade in the stock market. It tells you where big traders are placing their money, where support and resistance levels are forming, and whether the market mood is bullish or bearish. So let’s start from the basics and slowly move to the deeper parts like open interest and put-call ratio.
Highlight key
- An options chain shows all call and put options for a stock or index at different strike prices.
- Open Interest (OI) tells you how many contracts are still active in the market.
- Change in Open Interest shows fresh buying or selling activity.
- Volume in options trading tells you how active a strike price is today.
- Put Call Ratio (PCR) helps you understand if the market is more bullish or bearish.
- Implied Volatility and Option Greeks give extra clues about price movement and risk.
What Is an Options Chain?
An options chain is basically a table. It lists all the call and put options available for a stock or index, along with their strike prices, premiums, open interest, volume, and other details. Think of it like a menu card at a restaurant. Just like a menu shows you different dishes with their prices, an options chain shows you different strike prices with their premiums and other data.
If you are trading Nifty or Bank Nifty, the options chain will show you calls on one side and puts on the other side, with the strike prices sitting in the middle. Every strike price is like a bet on where the stock or index will move to.
Now, when people talk about how to read an options chain, they usually mean understanding these columns properly. It is not just about looking at numbers randomly. Each column tells a story. For example, if a certain strike price has huge open interest, it means a lot of traders have taken a position there. That strike price often acts like a wall, either stopping the price from going up or from going down.
In my experience, once you understand the basic layout of an options chain, everything else becomes much easier. So let’s break down each part one by one.
Understanding Call and Put Options
Before we go deeper, let’s quickly understand call and put options because the whole options chain is built around these two.
A call option gives the buyer the right to buy a stock at a fixed price, called the strike price, before a certain date. Traders buy calls options when they think the price will go up.
A put option lets the buyer sell a stock at a set price before a specific date. Traders buy puts when they think the price will go down.
In an options chain, calls are usually shown on the left side and puts on the right side. The strike prices sit in the middle, and they move from lower to higher.
Tell me the truth: when you first saw calls and puts together, did it feel confusing? It did for me too. But once you remember that calls are for “price going up” and puts are for “price going down,” the confusion goes away.
Understanding call and put options is the foundation of options chain analysis. Without knowing this basic difference, none of the other data will make sense to you.
What Is Strike Price and Why It Matters
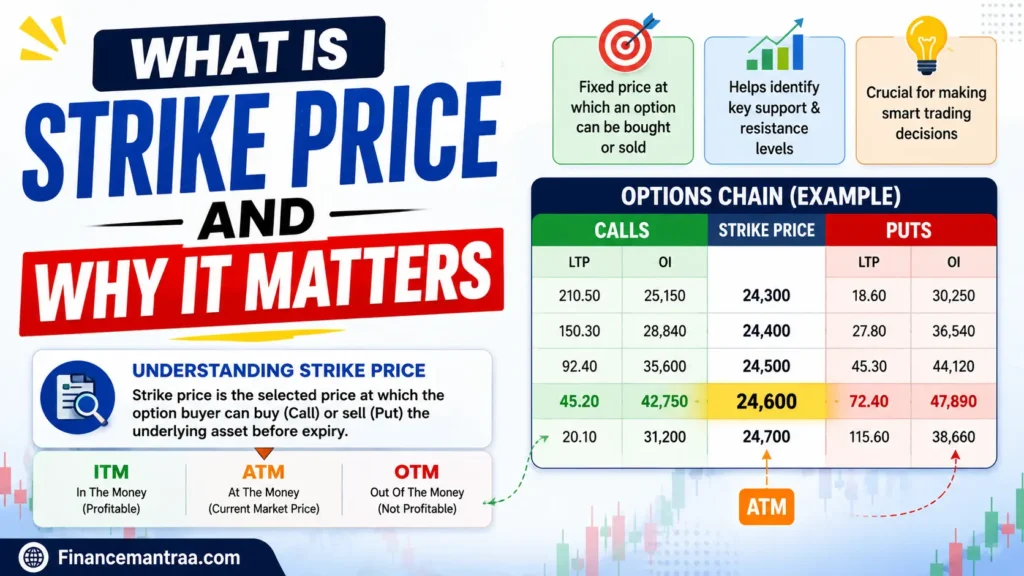
The strike price is the fixed price at which the option can be exercised. In the options chain, you will see many strike prices listed in a column, usually in the center of the table.
For example, if Nifty is trading around 24,500, you will see strike prices like 24,300, 24,400, 24,500, 24,600, 24,700, and so on. Each of these has its own call and put option with different premiums.
The strike price closest to the current market price is called “At The Money” or ATM. Strikes below the current price for calls are “In The Money,” or ITM, and strikes above are “Out of The Money” or OTM. For puts, it works the opposite way.
Now, here is something important. Traders often watch which strike prices have the highest activity. If a lot of people are buying options at a certain strike price, it usually means the market expects the price to move near that level. This is why understanding strike price in the options chain helps you guess possible support and resistance zones.
However, strike price alone does not tell the full story. You should also look at open interest and trading volume, which we’ll cover next.
Open Interest in Options: What It Really Means
This is probably the most important part when learning how to read an options chain. Open Interest, or OI, tells you the total number of option contracts that are still open and have not been settled or closed.
If Open Interest is high at a particular strike price, it means many traders have taken positions there. This strike price becomes an important level to watch. High call OI often works like a resistance level, because a lot of call sellers do not want the price to cross that point. High put OI often works like a support level, because put sellers do not want the price to fall below that point.
In my experience, checking option chain open interest before taking a trade has saved me from many bad decisions. Once I ignored the OI data and entered a trade near a strong resistance zone, and the price got stuck exactly there for two days. After that day, I always check OI before entering any position.
But friends, OI alone is not enough. You also need to see the change in open interest, because that tells you what is happening right now, not just what happened in the past.
Change in Open Interest: The Real Signal
Change in Open Interest shows how much the OI has increased or decreased compared to the previous day. This is where the real action is.
If OI is increasing along with rising prices, it usually means fresh buying is happening, and the trend might continue. If OI is increasing while prices are falling, it usually means fresh selling is happening. If OI is decreasing, it often means traders are closing their old positions, which can signal the end of a trend.
So when you look at change in open interest, always combine it with the price movement. This combination gives you a much clearer picture than just looking at OI or price alone.
If you think as I do, you will agree that numbers without context do not mean much. Change in OI gives that context, and it is one of the best tools for options chain analysis.
Volume in Options Trading
Volume tells you how many contracts have been traded during the day for a particular strike price. It is different from Open Interest, and many beginners confuse the two.
Open Interest is the total number of contracts still active. Volume is how many contracts changed hands today. High volume at a strike price means a lot of trading activity is happening there right now.
When you see high volume along with high OI, it usually confirms that the strike price is genuinely important. But if volume is high while OI stays flat, it could just mean traders are entering and exiting quickly, without holding long-term positions.
Using volume and open interest together in options trading gives you a stronger signal than using either one alone. This is a simple trick, but honestly, very few beginners actually use it properly.
How to Use Put Call Ratio in Options Chain
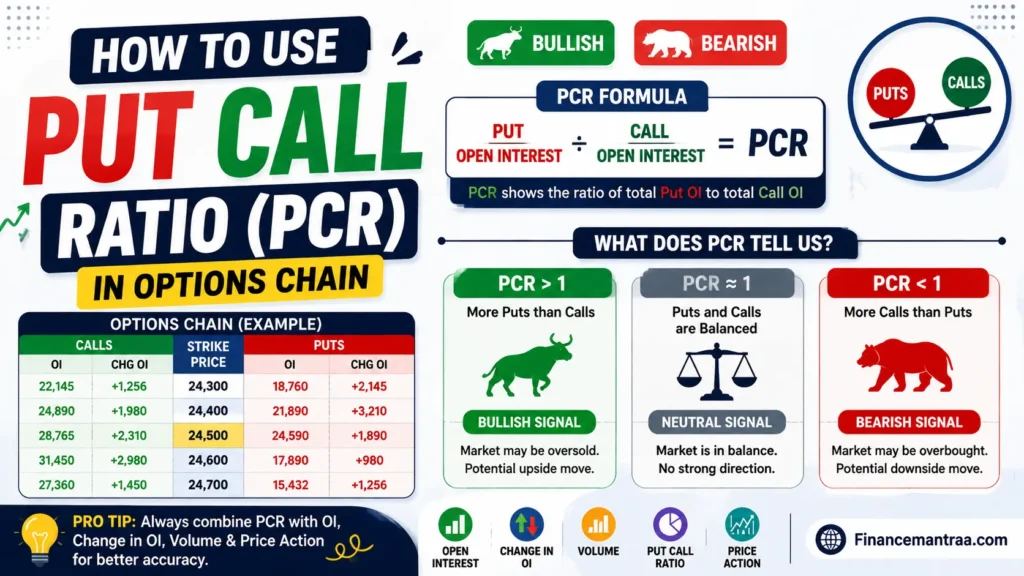
Put Call Ratio, or PCR, is calculated by dividing the total put OI by the total call OI. It is one of the easiest tools to understand market mood.
If PCR is above 1, it means there are more puts than calls, which is usually seen as a bullish signal, because too much put buying at extreme levels often means the market is oversold. If PCR is below 1, it means there are more calls than puts, which is often seen as a bearish signal for similar reasons.
However, please do not depend only on PCR for your trading decisions. It works best as a supporting tool, not the main decision maker. Combine put call ratio with open interest, change in OI, and price action for better accuracy.
A Quick Word on Implied Volatility and Option Greeks
You will also see columns for Implied Volatility, or IV, in the options chain. IV tells you how much the market expects the price to move. Higher IV means the price may move more, so options usually become more expensive.
Option Greeks like Delta, Gamma, Theta, and Vega are also shown sometimes. These tell you how sensitive the option price is to different factors like time, price change, and volatility. As a beginner, you do not need to master all of this immediately. Just know that these exist, and slowly learn them as you gain experience.
How to Read Options Chain for Nifty and Bank Nifty
If you want to practice, open the options chain for Nifty or Bank Nifty on any trading app or the NSE website. Look at the strike price closest to the current market price. Check the OI and change in OI on both call and put sides. See where the highest OI is sitting, because that often becomes a strong support or resistance zone.
Do this daily for a few weeks, and slowly you will start noticing patterns. This is exactly how most experienced traders learn how to read an options chain, through daily practice, not just theory.
Final Thoughts
Friends, learning how to read an options chain is not something that happens in one day. It takes practice, patience, and daily observation. Start with the basics, understand call and put options, learn about strike price, then move to open interest, change in OI, volume, and finally put-call ratio.
However, always remember that options chain data gives you clues, not guarantees. The market can surprise anyone. Use this knowledge along with proper risk management, and never risk more money than you can afford to lose.
I hope this guide made things clearer for you. Take your time, practice daily, and slowly you will become comfortable reading any options chain, whether it is for Nifty, Bank Nifty, or any other stock.
Disclaimer
This article is for educational and informational purposes only. It should not be considered as investment or trading advice. Options trading involves high risk, and there is a chance of losing money. Please do your own research or consult a SEBI-registered financial advisor before making any trading decisions. The author and website will not be responsible for any financial loss.
FAQ's
What is open interest in options chain?
Open interest shows the total active option contracts not yet closed. High OI at a strike price usually signals strong trader interest and potential support or resistance level.
What does change in open interest mean in options?
It shows a daily increase or decrease in OI. Rising OI with price movement signals fresh positions, while falling OI signals traders closing existing positions.
How do I use the put-call ratio in the options chain?
Divide total put OI by call OI. Above 1 often signals bullish mood, below 1 often signals bearish mood, but use with other indicators.
How can I identify support and resistance using the options chain?
Check strikes with the highest call OI for resistance and the highest put OI for support. These levels often show where price movement may pause.
What is the difference between volume and open interest in options trading?
Volume counts contracts traded today, while open interest counts total active contracts. Together they confirm genuine trading interest at a strike price.
How to read the options chain for beginners in simple steps?
Start with strike price, then check OI, change in OI, volume, and PCR. Practice daily on Nifty or Bank Nifty for better understanding.