
Friends, if you have ever looked at a stock chart and felt totally lost, don’t worry, I was there too. When I started trading, I kept hearing traders talk about “RSI” like it was some magic formula.
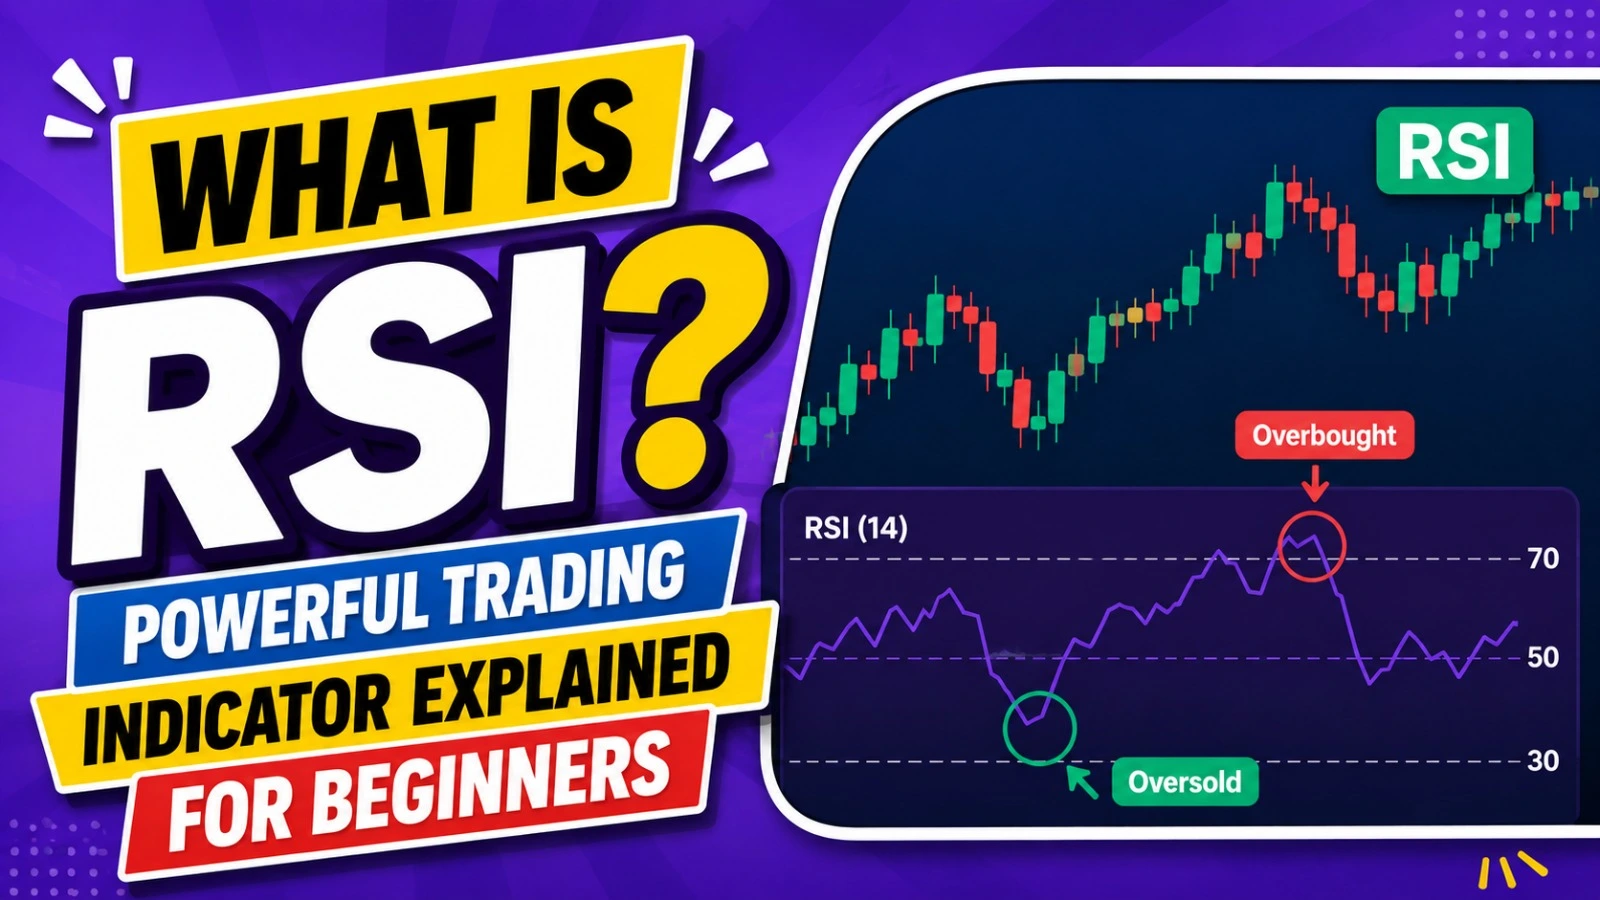
So today, I want to answer the question that brought you here: what is RSI? In simple words, RSI (Relative Strength Index) is a tool that tells you if a stock is priced too high or too low, right now, based on its recent price moves. Once you understand this one indicator, reading charts gets a lot less scary.
I remember the first time I used RSI on a live trade. I was watching a stock that had jumped up fast in just three days. My gut said “buy more,” but the RSI was screaming something else. I’ll tell you what happened a little later in this article. For now, let’s break down what is RSI, how it works, and how you can actually use it without getting confused.
Highlight key
- RSI meaning: a momentum indicator that measures how fast and how much a stock’s price has moved recently
- RSI value moves between 0 and 100
- Above 70 usually means overbought, below 30 usually means oversold.
- RSI helps spot trend strength, reversals, and divergence
- It works best when combined with other tools, not alone.
- Good for beginners because the numbers are easy to read
What Is RSI in Stock Market?
So, what is RSI in stock market terms exactly? RSI stands for Relative Strength Index. It was created by a technical analyst named J. Welles Wilder back in 1978, and honestly, it has stood the test of time. The RSI indicator in technical analysis is used to measure the speed and change of price movements over a set period, usually 14 days.
Think of RSI like a speedometer for a stock. It doesn’t tell you where the car (stock) is going, but it tells you how fast it has been moving lately. If a stock has been going up really fast, the RSI number climbs high. If it has been falling hard, the RSI number drops low. This simple idea is why so many traders, from beginners to pros, keep RSI on their charts.
In my experience, new traders often confuse RSI with the actual stock price. But that’s not right. RSI is a separate number, shown usually below the main price chart, moving between 0 and 100. It does not tell you the price of the stock. It tells you the strength or weakness behind that price move.
RSI Meaning and How It Is Calculated
Let’s talk about the RSI meaning in a little more depth, without making it too technical. The formula behind RSI compares the average gains to the average losses over a chosen time period, usually 14 candles (days, hours, or whatever timeframe you are using).
Here’s the basic idea in simple words:
- The tool looks at how many days the stock closed higher versus lower.
- It averages the size of the up moves and the down moves.
- It turns this into a single number between 0 and 100
There’s no need to calculate it yourself. Every trading app and charting platform, whether it’s TradingView, Zerodha Kite, or Groww, plots this line automatically. Your job is just to read it correctly, and that’s what we’ll cover next.
How Does the RSI Indicator Work?
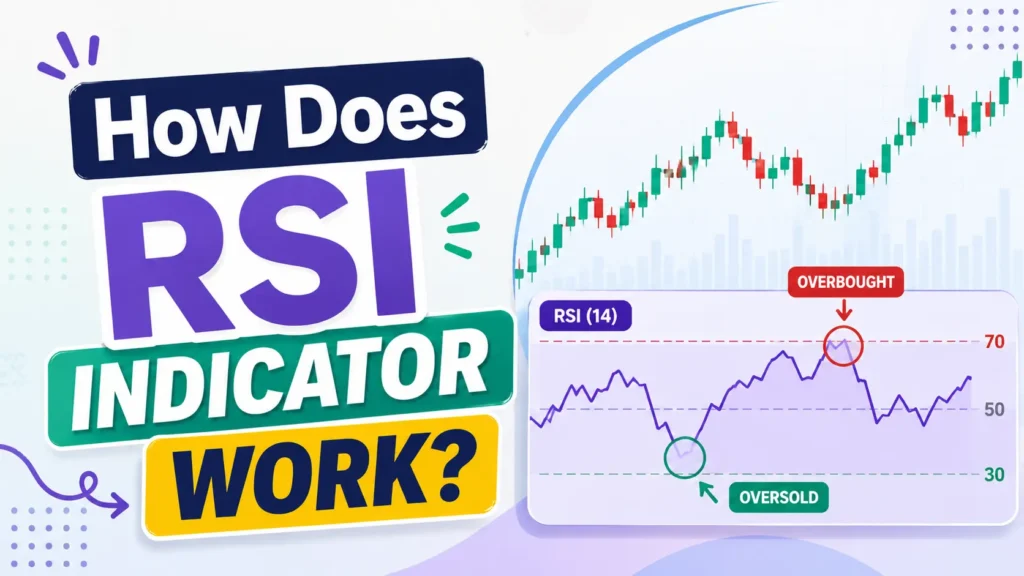
Now let’s talk about how the RSI indicator works in real trading. The RSI line moves up and down between 0 and 100 based on price momentum. Here’s the simple breakdown:
- When RSI is above 70, the stock is considered overbought. This means the price has moved up too fast, too quickly, and a pullback or correction might be near.
- When RSI is below 30, the stock is considered oversold. This means the price has fallen too much, too fast, and a bounce back might be coming.
- When RSI is between 30 and 70, the stock is in a more neutral zone, showing balanced buying and selling pressure.
Tell me the truth, doesn’t that sound simple? It really is. The tricky part is not the numbers; it’s learning not to blindly trust them every single time. RSI overbought and oversold signals work well in a sideways or range-bound market. But in a strong trending market, RSI can stay overbought or oversold for a long time. This is one mistake I made early on. I sold a stock too early because RSI touched 75, and the stock kept climbing another 20% after that. Lesson learned: RSI shows probability, not certainty.
What Is a Good RSI for Buying Stocks?
This is one of the most searched questions, so let’s answer it directly. What is a good RSI for buying stocks? Many traders look for RSI dropping below 30 and then coming back up above it. This is often seen as a signal that selling pressure is fading and buyers might be stepping back in.
However, friends, don’t just buy anything because RSI touched 30. Always check the bigger picture too, like the overall trend, support levels, and news around the company. A good RSI trading strategy combines RSI with price action, not RSI alone.
Some traders also like buying when RSI is between 40 and 50 during an uptrend, since this often shows a healthy pullback rather than a full reversal. There is no single magic number, but understanding the zones helps you make better decisions.
What Does RSI 70 and RSI 30 Mean?
Let’s clear this up simply, since it confuses a lot of beginners. What does RSI 70 and RSI 30 mean? These two numbers are the classic overbought and oversold levels.
- RSI above 70: the stock has been bought aggressively, and momentum may be stretched
- RSI below 30: the stock has been sold aggressively, and momentum may be exhausted
Some traders use tighter levels, like 80 and 20, especially for very volatile stocks, because normal 70/30 levels get triggered too often in fast-moving markets. If you think as I do, you’ll test both settings on your favorite stocks and see which one gives cleaner signals for that particular stock.
How to Read RSI Indicator on a Chart
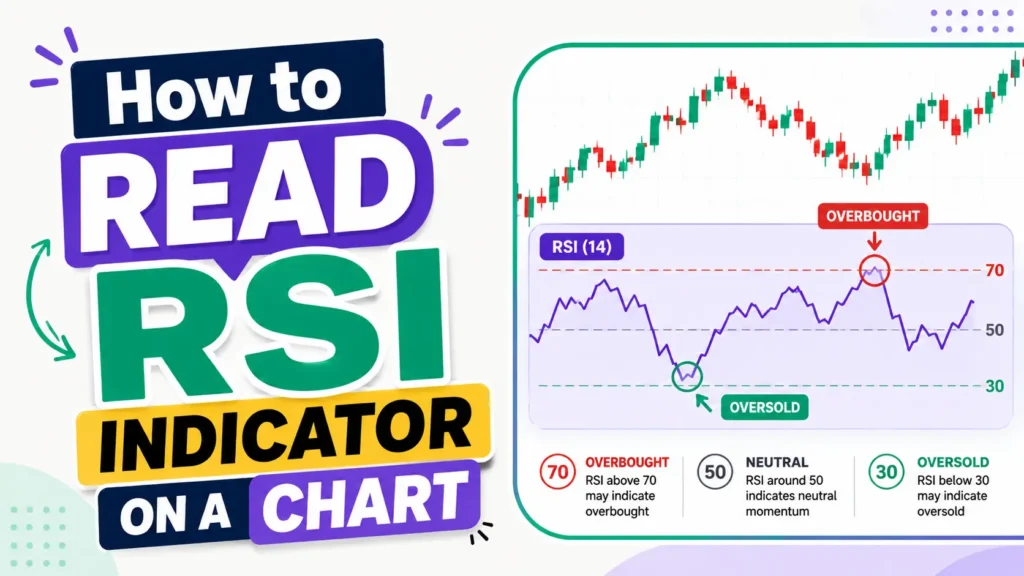
Reading the RSI indicator on a chart is easier than people think once you know where to look. Most charting platforms show RSI as a separate line below your candlestick chart, with horizontal lines marking the 70 and 30 levels.
Here’s what to watch for:
- Line crossing above 30 from below: possible buying opportunity
- Line crossing below 70 from above: possible selling opportunity
- Line staying flat near 50: weak or no clear trend
- Sharp spikes: strong momentum, but be careful of sudden reversals
However, don’t just stare at the RSI line alone. Always compare it with the price chart happening at the same time. This combination is what makes RSI analysis actually useful.
What Is RSI Divergence in Trading?
Now let’s talk about something a bit more advanced but still important: what is RSI divergence in trading? Divergence happens when the price and the RSI line move in opposite directions.
- Bullish divergence: When the price makes a new lower low, but the RSI makes a higher low. This may be a sign that the price could soon move upward.
- Bearish divergence: price makes a higher high, but RSI makes a lower high. This can hint at a possible downward reversal.
Divergence is one of my favorite parts of RSI analysis because it often shows weakness before the price actually changes direction. That said, divergence signals can take time to play out, so patience is needed. Don’t jump in the moment you spot one.
RSI Indicator Settings for Beginners
If you’re just starting out, don’t overthink the RSI indicator settings for beginners. The default setting of 14 periods works well for most stocks and most timeframes. This is the setting Wilder originally designed, and it remains the most widely trusted setting today.
As you become more confident, you can try out:
- Shorter periods, like 9, for faster signals but more noise
- Longer periods, like 21, for smoother signals but slower reaction
For beginners, I genuinely suggest sticking with the default 14 period setting until you fully understand how RSI behaves on the stocks you usually trade.
Best RSI Settings for Stock Trading
The best RSI settings for stock trading really depend on your trading style. Here’s a quick and honest breakdown:
- Day traders: shorter RSI periods, like 7 or 9, for quicker signals
- Swing traders: standard 14-period RSI works fine
- Long-term investors: some prefer 21 or even weekly RSI charts for slower, more reliable signals
There’s no single “best” setting that works for everyone. Therefore, test a few settings on your regular watchlist stocks before deciding what suits you.
How to Identify Overbought Stocks Using RSI
Wondering how to identify overbought stocks using RSI? Simply watch for the RSI line moving above 70. But here’s the honest part, an overbought stock doesn’t always mean it will fall immediately. In strong bull trends, stocks can stay overbought for weeks.
A smarter approach is to combine RSI with volume and price action. If RSI is above 70 and volume is dropping, that’s a stronger warning sign than RSI alone.
How to Identify Oversold Stocks Using RSI
Similarly, how to identify oversold stocks using RSI? Look for the RSI line dropping below 30. This suggests selling has been heavy and a bounce could be near. Again, don’t buy purely because of this signal. Check if the stock has strong fundamentals and isn’t oversold because of genuinely bad news.
RSI Trading Strategy for Beginners
Here’s a simple RSI trading strategy for beginners that I personally recommend starting with:
- Use the default 14-period RSI setting.
- Wait for RSI to cross below 30, then wait for it to cross back above 30
- Confirm with the overall trend on a higher timeframe.
- Set a stop loss below recent support.
- Avoid trading purely on RSI during strong trending markets.
This isn’t a guaranteed formula, but it’s a solid, honest starting point for anyone learning how to use the RSI indicator for trading.
Final Thoughts
So, coming back to that trade I mentioned earlier, when RSI was screaming overbought while my gut said buy more, I listened to the RSI that time and booked partial profits. The stock corrected 12% over the next week. That one decision taught me to respect this indicator, not blindly, but as one useful piece of the puzzle.
Friends, RSI is not a crystal ball. It won’t predict the future perfectly. But it gives you a genuine edge in understanding momentum, spotting overbought and oversold zones, and catching early signs of reversal through divergence. Use it alongside price action, support and resistance, and your own research, and you’ll find it becomes one of the most reliable tools in your trading toolkit.
Disclaimer:
This article is for educational purposes only and should not be considered financial or investment advice. Stock market trading and investing involve risk, including the risk of loss. Please consult a certified financial advisor before making any trading or investment decisions.
FAQ's
What is RSI in the stock market?
RSI, or Relative Strength Index, is a momentum tool that shows if a stock is overbought or oversold, using a number scale between 0 and 100.
What is a good RSI for buying stocks?
Many traders watch for RSI near or below 30, bouncing back upward, though it should always be confirmed with trend and price action first.
What does RSI 70 and RSI 30 mean?
RSI above 70 signals overbought conditions, while RSI below 30 signals oversold conditions, hinting at possible price reversals in either direction soon.
How does the RSI indicator work?
RSI compares average recent gains to average recent losses, converting momentum into a single number between 0 and 100 for easy reading.
What is RSI divergence in trading?
Divergence happens when price and RSI move opposite ways, often signaling weakening momentum and a possible trend reversal ahead for traders.
What are the best RSI settings for stock trading?
The default 14-period setting works well for most traders, though day traders often prefer shorter, faster periods like 7 or 9.